Investing in Koh Samui real estate has become increasingly attractive for international buyers seeking both lifestyle benefits and solid financial returns. With gross rental yields typically ranging from 6-12% and net yields of 4-8%, the island offers compelling opportunities compared to many Western markets where yields often struggle to reach 3-4%.
However, for USD-based investors, there’s a critical factor that most generic ROI calculators ignore: currency exchange risk. The USD/THB exchange rate has fluctuated between 30 and 37 over the past five years, a swing that can turn a profitable investment into a loss when repatriating funds, or amplify gains significantly when the timing is right.
This comprehensive guide provides the only USD-to-THB Koh Samui property calculator that accounts for currency fluctuations, seasonal variations, area-specific data, and hidden costs that most investors overlook. Whether you’re analyzing your first overseas property or expanding an existing portfolio, this guide gives you the complete financial picture you need to make data-driven investment decisions.
What Are The Basics To ROI for Samui Property?
Before diving into currency considerations, let’s establish the fundamental metrics every property investor must understand.
Gross Rental Yield vs. Net Rental Yield
Gross Rental Yield = (Annual Rental Income ÷ Property Purchase Price) × 100
This is the simple calculation most promoters quote. It’s useful for quick comparisons but dangerously incomplete for actual investment decisions.
Net Rental Yield = (Annual Rental Income − Operating Expenses) ÷ Property Purchase Price × 100
This is the metric that matters. Net yield accounts for the real costs of property ownership and management.
Typical Koh Samui Returns (2026 Data)
| Property Type | Gross Yield | Net Yield | Notes |
|---|---|---|---|
| Luxury Villas | 8%–15% | 5%–10% | Higher yields in prime locations with professional management |
| Mid-Range Condos | 6%–10% | 4%–7% | Depends heavily on building quality, amenities, and location |
| Budget Condos | 5%–8% | 3%–5% | More price-sensitive tenants and potentially higher vacancy rates |
| Beachfront Properties | 10%–20% | 6%–12% | Premium locations can command higher nightly or rental rates |
The 2% Rule and Koh Samui Application
The classic real estate “2% rule” suggests monthly rent should equal at least 2% of purchase price for strong cash flow. In Koh Samui:
- Monthly rent = 1.5-2.5% of purchase price is achievable for well-managed properties
- Monthly rent <1% indicates overpriced property or below-market rental strategy
- Monthly rent >2.5% warrants scrutiny and may indicate hidden problems or unsustainable pricing
Cash Flow vs. Appreciation
Koh Samui investors typically prioritize cash flow over appreciation
- Cash Flow Strategy: Focus on rental yield, immediate income generation
- Appreciation Strategy: Speculate on future value increases (riskier, less predictable)
- Hybrid Approach: Balance both for total return optimization
Historical appreciation in Koh Samui has been modest (2-4% annually) compared to rental yields, making cash flow the more reliable return component.
How Does Currency Difference Impact ROI?
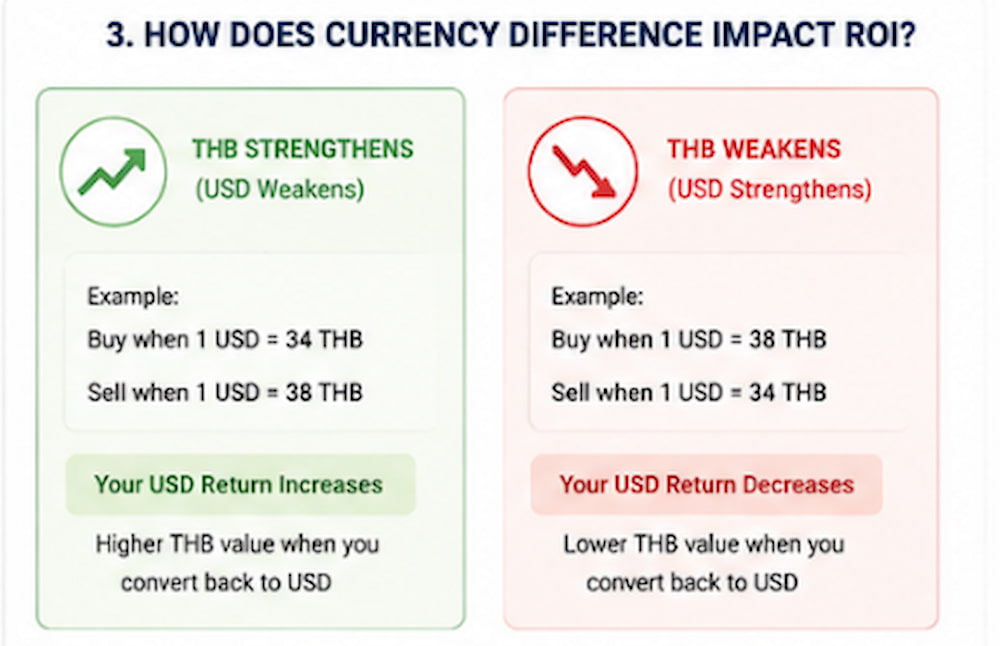
This is where Koh Samui property investment diverges significantly from domestic US real estate. Currency movements can dwarf property performance in either direction.
Historical USD/THB Exchange Rate Analysis
| Period | THB / USD Rate Range | Impact on $100K Investment |
|---|---|---|
| 2021–2022 | 32–34 THB/USD | Stable, with minimal currency impact |
| 2022–2023 | 34–37 THB/USD | US dollar strengthened by around 8%–10% |
| 2023–2024 | 35–36 THB/USD | Relatively stable exchange-rate environment |
| 2024–2025 | 34–35 THB/USD | Slight weakening of the US dollar |
| 2025–2026 | 34–35 THB/USD | Current estimated range |
Key Insight: A US investor buying when USD/THB was 37 and selling when it’s 32 faces a 13.5% currency headwind which potentially erased years of rental yield gains.
Currency Risk Scenarios
Scenario 1: Favourable Currency Movement (USD Strengthens)
- Purchase: 35 THB/USD
- Sale: 38 THB/USD
- Property value unchanged in THB
- USD return boosted by 8.6% from currency alone
Scenario 2: Unfavourable Currency Movement (USD Weakens)
- Purchase: 35 THB/USD
- Sale: 32 THB/USD
- Property value unchanged in THB
- USD return reduced by 8.6% from currency alone
Scenario 3: Currency-Neutral Strategy
- Maintain THB reserves for expenses
- Reinvest rental income locally
- Delay repatriation until favourable rates
- Minimises currency impact on long-term holds
Timing Strategies for Currency-Conscious Investors
1. Monitor Key Indicators
- US Federal Reserve policy (rate hikes strengthen USD)
- Bank of Thailand monetary policy
- Thailand’s trade balance and tourism recovery
- Regional economic stability
2. Dollar-Cost Averaging for Large Transfers
- Split $500K purchase into 5 × $100K transfers
- Execute over 3-6 months
- Reduces impact of short-term volatility
3. Forward Contracts for Certainty
- Lock in exchange rate for future transfers
- Available for 6-12 month horizons
- Requires deposit (typically 10%)
- Best for investors with definite purchase timelines
4. Maintain Currency Flexibility
- Keep 6-12 months of operating expenses in THB
- Reduces need for frequent small conversions
- Allows strategic timing of larger repatriations
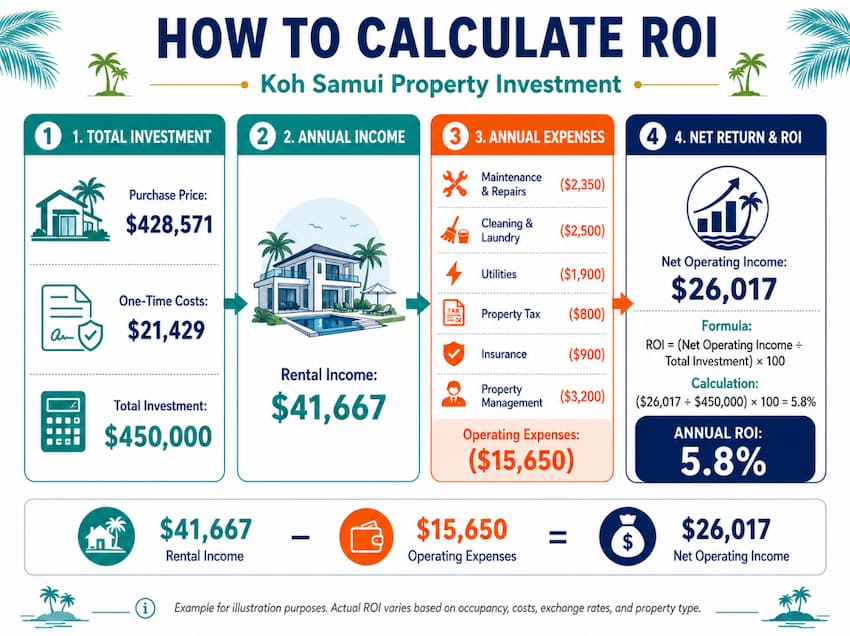
How To Calculate ROI?
INPUT SECTION
Property Details
| Investment Input | Example Entry | Your Entry |
|---|---|---|
| Purchase Price in THB | 15,000,000 THB | ________ |
| Purchase Price in USD | $428,571, based on 35 THB/USD | Auto-calculated |
| Property Type | 3-bedroom villa | ________ |
| Property Location | Bophut | ________ |
Rental Income Assumptions
| Input | Conservative | Moderate | Optimistic |
|---|---|---|---|
| Nightly Rate; High Season | 8,000 THB | 10,000 THB | 12,000 THB |
| Nightly Rate; Low Season | 4,000 THB | 5,000 THB | 6,000 THB |
| High Season Occupancy | 75% | 85% | 90% |
| Low Season Occupancy | 40% | 50% | 60% |
| High Season Period | 4 months, Dec–Mar | 4 months, Dec–Mar | 4 months, Dec–Mar |
| Low Season Period | 8 months, Apr–Nov | 8 months, Apr–Nov | 8 months, Apr–Nov |
Operating Expenses
| Expense Category | Percentage of Rental Income | Fixed Amount (THB / Month) |
|---|---|---|
| Property Management | 20% | — |
| Cleaning & Maintenance | 10% | — |
| Utilities | — | 8,000 THB |
| Insurance | — | 12,500 THB |
| Marketing / OTA Fees | 15% | — |
| Repairs Reserve | 5% | — |
| Accounting / Legal | — | 5,000 THB |
Currency Assumptions
| Input | Conservative | Moderate | Optimistic |
|---|---|---|---|
| Purchase Exchange Rate | 34 THB/USD | 35 THB/USD | 36 THB/USD |
| Exit Exchange Rate | 32 THB/USD | 35 THB/USD | 38 THB/USD |
| Holding Period | 5 years | 5 years | 5 years |
OUTPUT SECTION
Annual Performance (THB)
| Metric | Conservative | Moderate | Optimistic |
|---|---|---|---|
| Gross Rental Income | 1,872,000 THB | 2,450,000 THB | 3,024,000 THB |
| Operating Expenses | 936,000 THB | 1,225,000 THB | 1,512,000 THB |
| Net Operating Income | 936,000 THB | 1,225,000 THB | 1,512,000 THB |
| Gross Yield | 12.5% | 16.3% | 20.2% |
| Net Yield | 6.2% | 8.2% | 10.1% |
Currency-Adjusted Returns (USD)
| Metric | Conservative | Moderate | Optimistic |
|---|---|---|---|
| Initial Investment | $441,176 | $428,571 | $416,667 |
| Annual Net Income | $29,250 | $35,000 | $39,789 |
| 5-Year Total Income | $146,250 | $175,000 | $198,945 |
| Exit Property Value | $421,875 | $428,571 | $460,526 |
| Total Return | $568,125 | $603,571 | $659,471 |
| Total ROI | 29% | 41% | 58% |
| Annualized ROI | 5.2% | 7.1% | 9.6% |
Break-Even Analysis
| Scenario | Estimated Years to Break Even |
|---|---|
| Conservative | 12–15 years |
| Moderate | 8–10 years |
| Optimistic | 6–8 years |
Is There A Difference in ROI For Varying Locations?
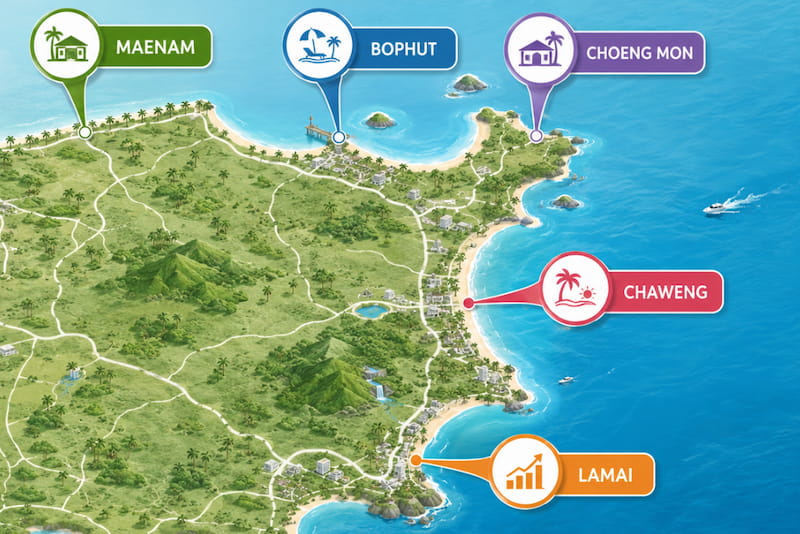
Not all Koh Samui locations offer equal returns. Here’s the data-driven breakdown:
Chaweng (East Coast)
| Metric | Value | Notes |
|---|---|---|
| Price per sqm | 100,000–150,000+ THB | Premium location |
| Nightly Rates | Highest on the island | Strong tourist hub |
| Occupancy; High Season | 85%–95% | Consistent demand |
| Occupancy; Low Season | 50%–65% | Moderate seasonal drop-off |
| Gross Yield Range | 8%–14% | High rental volume helps offset higher purchase prices |
| Net Yield Range | 5%–9% | Higher operating costs reduce final returns |
| Best For | High-turnover investors | Suitable for buyers who want nightlife proximity and strong tourist traffic |
Bophut (North Coast)
| Metric | Value | Notes |
|---|---|---|
| Price per sqm | 90,000–140,000 THB | Premium pricing around Fisherman’s Village |
| Nightly Rates | High | Upscale tourist area |
| Occupancy; High Season | 80%–90% | Strong demand, with good year-round appeal |
| Occupancy; Low Season | 45%–60% | Supported by the family rental market |
| Gross Yield Range | 7%–12% | Balanced risk and reward profile |
| Net Yield Range | 4.5%–8% | Good property management is critical |
| Best For | Upscale market | Suitable for family rentals and premium holiday stays |
Lamai (Southeast Coast)
| Metric | Value | Notes |
|---|---|---|
| Price per sqm | 70,000–110,000 THB | Value pricing compared with more established areas |
| Nightly Rates | Moderate | Supported by growing popularity |
| Occupancy — High Season | 75%–85% | Demand appears to be improving |
| Occupancy — Low Season | 40%–55% | Lower demand due to developing area status |
| Gross Yield Range | 8%–15% | Lower entry cost can support stronger yields |
| Net Yield Range | 5%–10% | Higher yields may be possible with good management |
| Best For | Value investors | Suitable for buyers seeking an emerging market opportunity |
Maenam (North Coast)
| Metric | Value | Notes |
|---|---|---|
| Price per sqm | 60,000–95,000 THB | Most affordable option |
| Nightly Rates | Moderate | Quieter area with less tourist traffic |
| Occupancy; High Season | 70%–80% | Lower than premium areas, but relatively stable |
| Occupancy; Low Season | 35%–50% | More noticeable seasonal drop-off |
| Gross Yield Range | 6%–12% | Returns vary significantly by property |
| Net Yield Range | 3.5%–8% | Strongly dependent on management quality |
| Best For | Budget-conscious investors | Suitable for long-term appreciation strategies |
Choeng Mon (Northeast Coast)
| Metric | Value | Notes |
|---|---|---|
| Price per sqm | 85,000–130,000 THB | Boutique area |
| Nightly Rates | High | Luxury segment |
| Occupancy; High Season | 80%–90% | Strong appeal during peak travel periods |
| Occupancy; Low Season | 40%–55% | More niche market outside peak season |
| Gross Yield Range | 7%–13% | Returns depend heavily on property quality |
| Net Yield Range | 4.5%–8.5% | Premium positioning can support stronger rates |
| Best For | Luxury market | Suitable for boutique positioning and premium holiday rentals |
Are There Any Additional Or Hidden Costs?
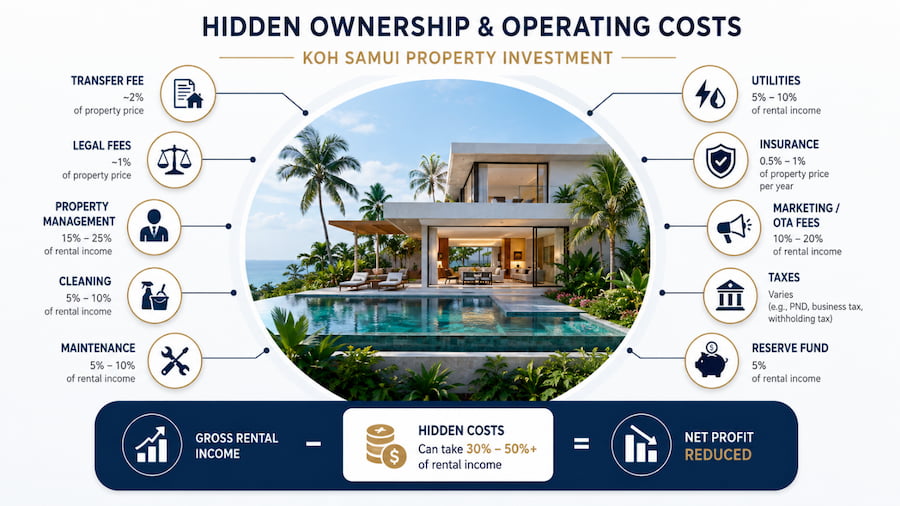
Most ROI calculations fail because they underestimate true operating costs. Here’s the comprehensive breakdown:
One-Time Purchase Costs (Often Overlooked)
| Cost Item | Typical Amount | Percentage of Purchase Price |
|---|---|---|
| Transfer Fee | 2% of appraised value | 1%–2% |
| Legal Fees | 50,000–150,000 THB | 0.3%–1% |
| Due Diligence | 20,000–50,000 THB | 0.1%–0.3% |
| Furniture / Equipment | 200,000–500,000 THB | 1%–3% |
| Initial Marketing Setup | 30,000–80,000 THB | 0.2%–0.5% |
| Contingency | 100,000–200,000 THB | 0.7%–1.3% |
| Total One-Time Costs | — | 3.3%–8.1% |
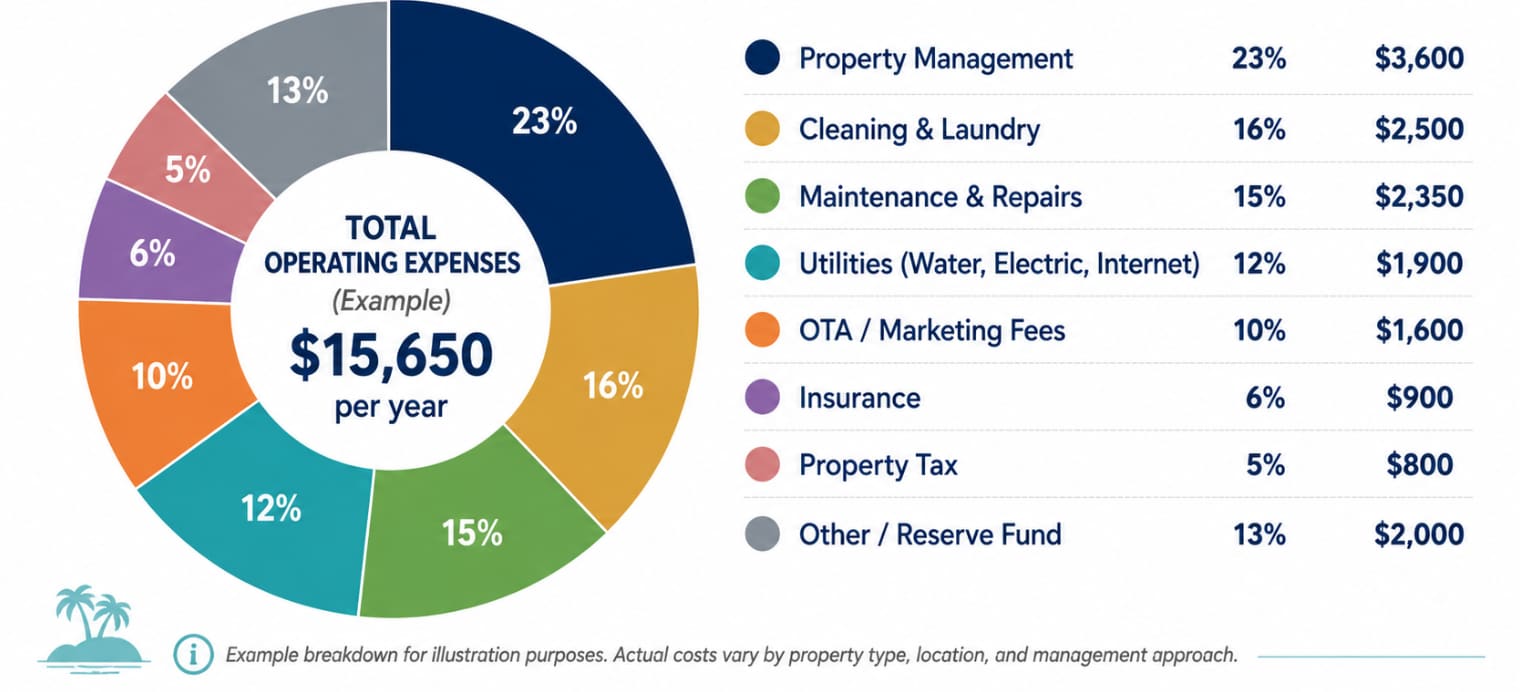
Annual Operating Expenses (The Reality)
| Expense Category | Conservative | Moderate | Luxury |
|---|---|---|---|
| Property Management | 15% of rent | 18% of rent | 20% of rent |
| Cleaning Services | 8% of rent | 10% of rent | 12% of rent |
| Maintenance / Repairs | 3% of property value | 2% of property value | 1.5% of property value |
| Utilities | 60,000 THB / year | 96,000 THB / year | 144,000 THB / year |
| Insurance | 0.08% of property value | 0.1% of property value | 0.12% of property value |
| Property Tax | 0.02% of property value | 0.05% of property value | 0.1% of property value |
| Marketing / OTA Commissions | 12% of rent | 15% of rent | 18% of rent |
| Accounting / Legal | 60,000 THB / year | 84,000 THB / year | 120,000 THB / year |
| Reserve Fund | 2% of rent | 3% of rent | 4% of rent |
| Total Operating Costs | 35%–45% of gross income | 40%–50% of gross income | 45%–55% of gross income |
Currency-Related Costs
| Cost Item | Typical Rate | Notes |
|---|---|---|
| Bank Transfer Fees | $25–$50 per transfer | Applies when sending funds in or out |
| Currency Spread | 1%–3% | Difference between the bank’s exchange rate and the mid-market rate |
| Forward Contract Premium | 0.5%–2% | Applies if using currency hedging |
| Annual Impact | 0.5%–2% of revenue | Depends on transfer frequency and exchange-rate method |
What Do The 5-Year Projections Look Like?
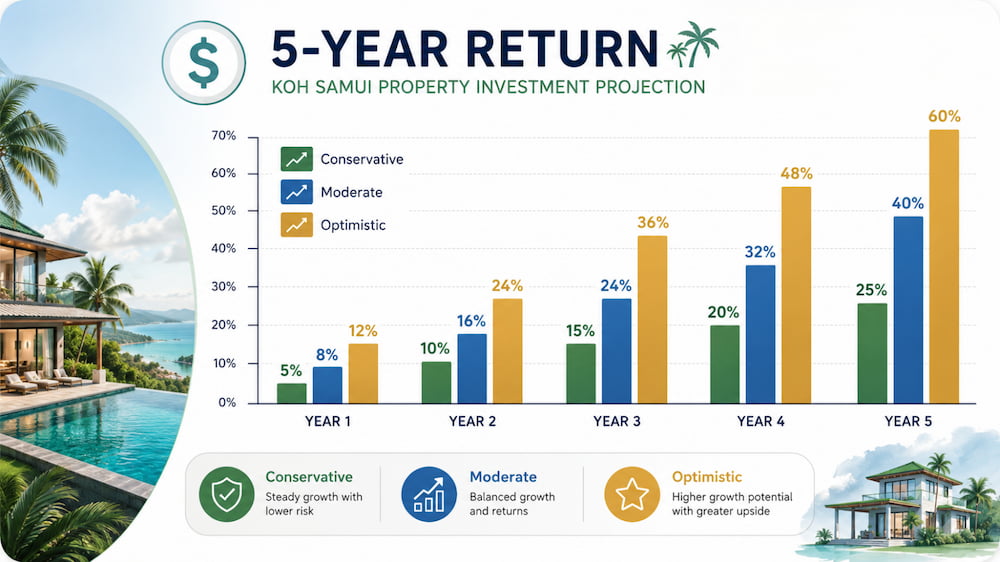
Conservative Scenario (Base Case)
Assumptions:
- Purchase: 15M THB villa in Lamai
- Purchase rate: 35 THB/USD ($428,571 USD)
- Exit rate: 33 THB/USD
- Annual appreciation: 2%
- Net yield: 6%
| Year | Property Value (THB) | Net Rental Income (THB) | Cumulative Income (THB) | USD Value at Exit Rate |
|---|---|---|---|---|
| 0 | 15,000,000 | — | — | $454,545 |
| 1 | 15,300,000 | 900,000 | 900,000 | $490,909 |
| 2 | 15,606,000 | 918,000 | 1,818,000 | $529,212 |
| 3 | 15,918,120 | 936,360 | 2,754,360 | $569,504 |
| 4 | 16,236,482 | 955,087 | 3,709,447 | $611,712 |
| 5 | 16,561,212 | 974,189 | 4,683,636 | $655,656 |
5-Year Total Return: $655,656 (53% total, 8.9% annualized)
Moderate Scenario (Expected Case)
Assumptions:
- Purchase: 15M THB villa in Bophut
- Purchase rate: 35 THB/USD ($428,571 USD)
- Exit rate: 35 THB/USD (neutral)
- Annual appreciation: 3%
- Net yield: 8%
| Year | Property Value (THB) | Net Rental Income (THB) | Cumulative Income (THB) | USD Value at Exit Rate |
|---|---|---|---|---|
| 0 | 15,000,000 | — | — | $454,545 |
| 1 | 15,300,000 | 900,000 | 900,000 | $490,909 |
| 2 | 15,606,000 | 918,000 | 1,818,000 | $529,212 |
| 3 | 15,918,120 | 936,360 | 2,754,360 | $569,504 |
| 4 | 16,236,482 | 955,087 | 3,709,447 | $611,712 |
| 5 | 16,561,212 | 974,189 | 4,683,636 | $655,656 |
5-Year Total Return: $692,571 (62% total, 10.1% annualized)
Optimistic Scenario (Best Case)
Assumptions:
- Purchase: 15M THB luxury villa in Chaweng
- Purchase rate: 35 THB/USD ($428,571 USD)
- Exit rate: 37 THB/USD (favorable)
- Annual appreciation: 4%
- Net yield: 10%
| Year | Property Value (THB) | Net Rental Income (THB) | Cumulative Income (THB) | USD Value at Exit Rate |
|---|---|---|---|---|
| 0 | 15,000,000 | — | — | $405,405 |
| 1 | 15,600,000 | 1,500,000 | 1,500,000 | $462,162 |
| 2 | 16,224,000 | 1,560,000 | 3,060,000 | $523,892 |
| 3 | 16,872,960 | 1,622,400 | 4,682,400 | $590,686 |
| 4 | 17,547,878 | 1,687,296 | 6,369,696 | $662,641 |
| 5 | 18,249,793 | 1,754,788 | 8,124,484 | $739,854 |
5-Year Total Return: $739,854 (73% total, 11.6% annualized)
Sensitivity Analysis: Currency Impact
| Year | Property Value (THB) | Net Rental Income (THB) | Cumulative Income (THB) | USD Value at Exit Rate |
|---|---|---|---|---|
| 0 | 15,000,000 | — | — | $405,405 |
| 1 | 15,600,000 | 1,500,000 | 1,500,000 | $462,162 |
| 2 | 16,224,000 | 1,560,000 | 3,060,000 | $523,892 |
| 3 | 16,872,960 | 1,622,400 | 4,682,400 | $590,686 |
| 4 | 17,547,878 | 1,687,296 | 6,369,696 | $662,641 |
| 5 | 18,249,793 | 1,754,788 | 8,124,484 | $739,854 |
Conclusion
Koh Samui property investment can be attractive for USD-based buyers, but strong returns depend on more than headline rental yields. Currency movement, net income, location, management costs, legal structure, and holding period all affect the final outcome. A property may look profitable at first glance, but the real picture only becomes clear once exchange rates, taxes, maintenance, and management fees are included.
The safest approach is to use realistic numbers and conservative projections. Currency matters because a 10% exchange-rate movement can significantly change USD returns, while net yield gives a more honest view than gross yield. Location also plays a major role: Chaweng may offer higher rental volume, Lamai may offer better value, and Bophut may provide a balanced mix of lifestyle and investment appeal. For overseas owners, professional management can also help protect occupancy, maintenance quality, and long-term property value.
For buyers who want reliable local support, Horizon Homes is a Koh Samui real estate company offering villas, condos, townhouses, land, and commercial properties for sale and rent, along with property management, maintenance, and guest services. If you are ready to buy property in Koh Samui, Horizon Homes can help you compare suitable options based on your budget, ROI goals, preferred location, and ownership structure.
Frequently Asked Questions
How accurate are these ROI projections?
These projections are based on 2026 market data and historical performance. Actual results will vary based on property selection, management quality, market conditions, and currency movements. The conservative scenario represents achievable returns with competent management, while optimistic scenarios require favorable conditions across all variables.
Should I factor in currency hedging costs?
For most individual investors, the cost of formal currency hedging (forward contracts, options) exceeds the benefit. A more practical approach is maintaining THB reserves for expenses and timing large repatriations strategically. Professional investors with $1M+ exposure may benefit from formal hedging.
What about property management fees, can I manage remotely myself?
While possible, self-managing from abroad is challenging. Local property managers provide: tenant communication, cleaning coordination, maintenance oversight, bill payment, and emergency response. The 15-20% fee is typically justified by higher occupancy rates and reduced headaches.
How do I account for vacancy periods in my calculations?
The occupancy rates in this calculator already factor in vacancy. High season (Dec-Mar) typically sees 80-90% occupancy for well-managed properties, while low season (Aug-Sep) may drop to 30-45%. Annual averages of 55-65% are realistic for quality properties.
What’s the minimum investment for meaningful returns?
While you can buy condos for 3-5M THB ($85,000-140,000 USD), the sweet spot for investment properties is 10-20M THB ($285,000-570,000 USD). This range offers better property quality, professional management options, and stronger rental demand.
How does financing affect ROI calculations?
Thai banks rarely lend to foreigners, so most US buyers purchase with cash. If you use a home equity loan against US property, factor in: interest costs (typically 6-8%), loan fees, and the currency risk of owing USD while owning THB assets. Cash purchases simplify ROI calculations and reduce risk.
Should I buy off-plan or completed property?
Completed properties offer immediate rental income and known quality but command premium prices. Off-plan purchases may offer 10-20% discounts but carry developer risk, construction delays, and uncertain final quality. First-time investors should generally choose completed properties.
How do taxes affect my net returns?
Thailand imposes: transfer taxes (2%), annual property tax (0.02-0.1%), and withholding tax on rental income (progressive rates). US citizens must also report rental income to the IRS but can claim Foreign Tax Credits. Budget 1-2% of gross rental income for tax compliance costs.
What’s the typical payback period for Koh Samui property?
Based on net yields of 4-8%, simple payback ranges from 12-25 years. However, this ignores property appreciation and currency effects. Total return investors often see positive cash flow from year one while building equity.
How do I choose between condo and villa investment?
Condos: Lower entry cost, simpler management, foreign ownership straightforward, but higher density competition and building-dependent quality.
Villas: Higher yields possible, more differentiation, land lease complexity, higher management requirements, larger capital requirement.
Most investors start with condos for simplicity, then expand to villas as they gain experience.